Taking Apart the MACD Indicator
Today I will focus on the most common way traders utilize the MACD and show you some basic examples so that you can become a bit more familiar with the MACD indicator.
From my personal experience I can tell you that many traders find the MACD very complicated and avoid using it because of that.
In reality the MACD is one of the simplest indicators to use once you understand the different parts of the indicator. This is why I decided to separate the MACD into three different tutorials.
The Center Line Crossover
The center line crossover is one of the most popular methods of utilizing the MACD Indicator. A bullish center line crossover occurs when the MACD moves above the zero line and turns positive.
This happens when the 12-day EMA of the underlying market moves above the 26-day EMA. A bearish crossover occurs when the MACD moves below the zero line to turn negative.
This happens when the 12-day EMA moves below the 26-day EMA.
Label The MACD Indicator
Before I begin the analysis I want to label each part of the MACD Indicator to avoid any confusion. The indicator has three parts that all work together.
First, we have the MACD line, this is the indicator that is providing the difference between the 12 bar and the 26-bar moving average that you see on the chart.
The sole purpose of the MACD line is to show you a visual representation of the difference between the two moving averages.

MACD Line Is the Difference Between the Slow and Fast Moving Average
Grab this report and receive two strategies that explain how you can use options to substantially increase your trading consistency while dramatically managing your risk.
Grab Your FREE Report Right Here!
The next line is the Signal Line. The sole purpose of the Signal Line is to create a smoothing of the MACD Line.
The Signal Line creates a moving average of the MACD line. If you recall in yesterday’s tutorial I demonstrated the basics of trading MACD Line and Signal Line crossovers.

The Signal Line Does Not Take Market Price into Account
The next part of the MACD Indicator is the Histogram. This is simply the visual representation of the difference between the MACD Line and the Signal Line.
The wider apart the MACD Line moves away from the Signal Line the more activity you will see on the Histogram.
If there is very little or no distance between the MACD Line and the Signal Line then you would see very little or no action on the Histogram.

The Histogram Is the Difference Between the MACD Line and the Signal Line
To Make Life Easier
I suggest you look at the MACD Indicator as an external and internal indicator. Meaning the MACD Line represents what is currently happening in regard to market price.
However, the Signal Line and the Histogram are internal and only react to the indicator and not the market.
I call the Signal Line and the Histogram indicators for another indicator.

The MACD Line Relies on the Exponential Moving Averages
In today’s exercise we won’t be using either the Signal Line or the Histogram so you only need to focus on the MACD Line.
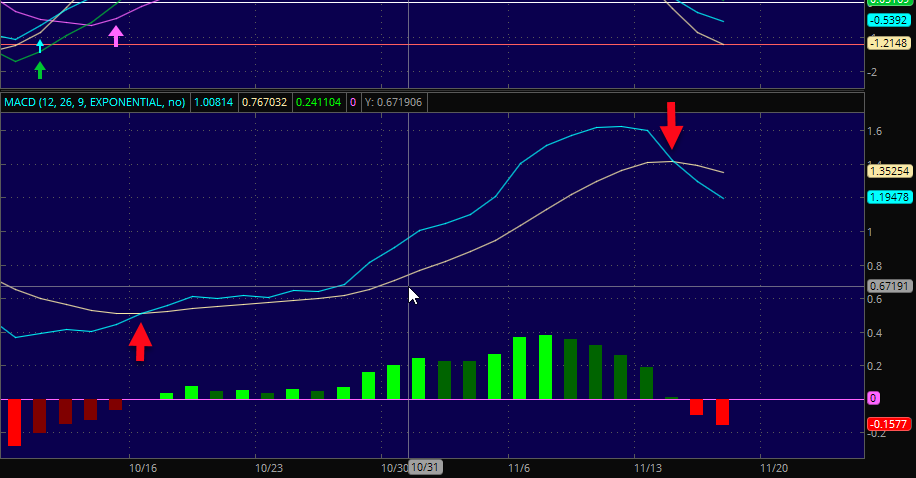
I’m going to turn on both of the moving averages so you can see how the Center Line crossover signal is generated.

Pay Attention Only to the Red Line
Generating Signals
Pay attention to the Moving Averages and notice what happens each time they cross each other both on the way up and on the way down.
Each time the moving averages cross each other the MACD Line crosses either above or below the Center Line.
Center Line is just a middle ground zero area and each time the MACD Line moves north of the Center Line it means that the short term or fast-moving average has crossed above the slow-moving average.
In our case the 12-day moving average is the fast-moving average and the 26-day moving average is the slow-moving average.
Conversely, each time the MACD Line moves south of the Center Line the slow-moving average has crossed above the fast-moving average and as a result the trend turned down.

Each Time the MACD Line Crosses the Zero Line the Moving Averages Cross Each Other
Things To Keep in Mind
Remember that the MACD should be looked at as two different indicators. An external indicator that reflects price and an internal indicator that reflects what the MACD does and avoids price completely.
By understanding each part of the MACD you can begin to see how all the pieces work together.