
When it comes to trading, one of the best ways to tell what’s happening is by paying attention to the flow of money in and out of a stock.
Surely, none of us want to buy a stock if money is flowing out, right?
Instead, we want to buy if we’re seeing money flow in, or short if we begin to see signs that money is about to start flowing out of a stock.
One way to pinpoint when either is likely to happen is by paying attention to MFI, or the Money Flow Index – a popular indicator that indicates the strength of money flowing in or out. It’s also helpful when confirming price trends, producing signals of potential reversals from overbought and oversold conditions.
For example, if MFI is below 20, the stock is considered oversold.
If MFI is above 80, the stock is considered overbought.
About 80% of the time, when Money Flow dips well into oversold territory with a well-respected stock, it’s likely to bounce higher.
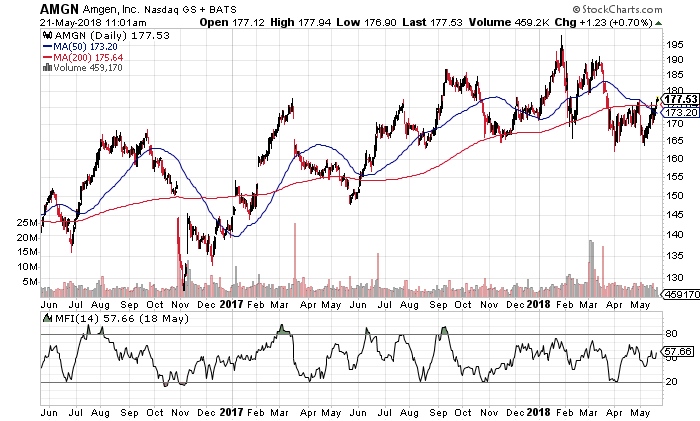
Look at Amgen (AMGN) for example.
Look at what happens each time MFI pushes to or above the 80-line. The stock begins to pivot and reverse lower, as it becomes clear that money is about to flow out of the name on excessively overbought conditions.
Is this simple 4 letter code the secret great trades in 72 hours?
This string of code could be very productive in just 72 hours. Really. This code has spit out 321 winning trades out of 324 tries in the past three years. That’s a 99.1% success rate.
Click here right now to see the INSANE details.
Or, look at what happens to the AMGN stock when MFI drops to or below the 20-line. The stock begins to bottom out, pivot and turn higher.
We can clearly see this has happened multiple times over the last two years alone.
Then again, we never want to rely on just MFI to buy or sell a stock, an ETF, or an index.
We want to confirm with other momentum indicators, including the Bollinger Bands (2,20), RSI and MACD, as well. For example, using these three other indicators we can again confirm exactly when the stock was likely to pivot and head in the other direction.
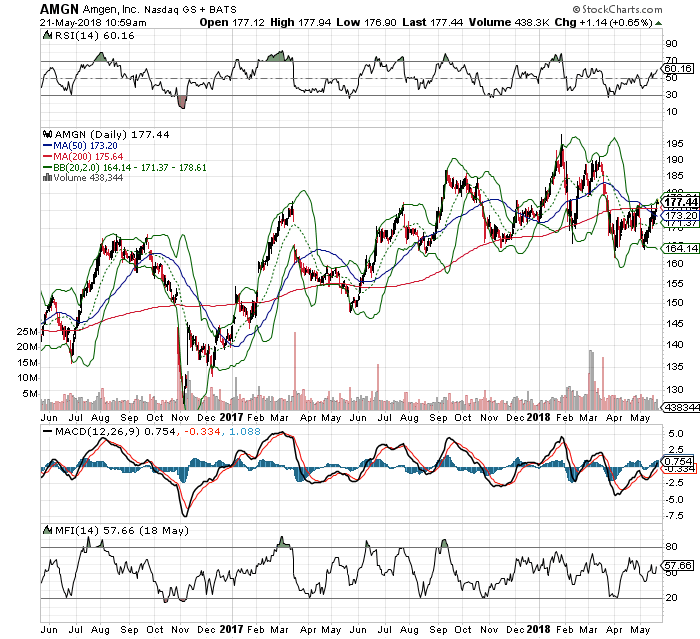
For example, in April 2017, with the AMGN stock at double bottom support, not only was MFI at its 20-line, but the RSI was oversold at its 30-line with MACD at an unsustainable, historic low. Plus, the stock was also at its lower Bollinger Band.
Even better, using these four momentum indicators alone, we can clearly see they’ve called major tops and bottoms in the same stock over the last two years.