When it comes to technical analysis, there are thousands of patterns to watch for, decipher and understand along the way.
They’re not so tough to understand.
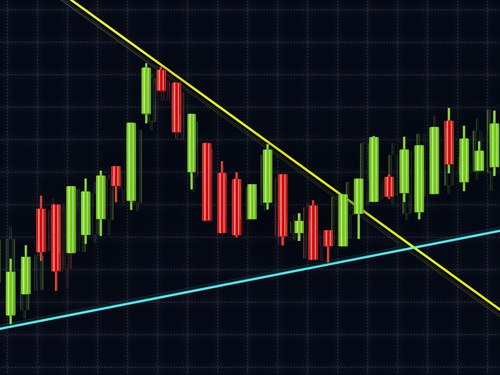
In fact, one of the easiest ones to understand is the channel, defined as two parallel trend lines within a tight trading range. The upper line connects the price peaks in the channel while the lower line connects the price lows.
What’s nice is that such lines tell you when to buy and when to sell. If the stock hits the upper line without breaking higher, you sell. When the stock hits the lower line without breaking through, you buy. There is an exception to the rule. Once the price breaks through the top or bottom line, the trade is over until a new channel has established itself.
There are then three types of channels to understand.
One is the ascending channel, where the price is contained between upward sloping lines with higher highs and higher lows along the way.

Is this simple 4 letter code the secret great trades in 72 hours?
This string of code could be very productive in just 72 hours. Really. This code has spit out 321 winning trades out of 324 tries in the past three years. That’s a 99.1% success rate.
Click here right now to see the INSANE details.
The second is the descending channel, where the price is contained between two downward sloping lines with lower highs and lower lows.

The third is the consolidation phase, or the horizontal channel where the stock in question trades sideways in a tight pattern of highs and lows.

And then, of course, if the trend is broken to the upside or downside, we have a potential breakout. The idea is that once a stock begins to break above prior resistance points, the stock has the potential to trend even higher and that once thousands of traders learn about it, they pour in. But the key to trading a breakout successfully is by being early.
Think of its like this. When you’re stopped at a stoplight, you don’t try to predict when the light will go green. Instead, you just hit the gas and hightail it out of there when it does. The same approach happens with a stock. Once it breaks above prior resistance points, we don’t wait.
Look at the Dow Jones again for example.
As you can see above, for a few months, the index traded within a tight channel between 19,750 and 19,971 before it broke out and exploded to a high of 20,600.